
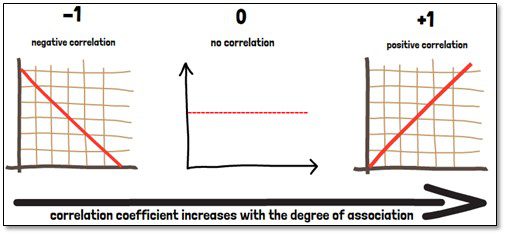
The correlation coefficient (r) is a specific measure that quantifies the strength of a linear statistical relationship between two variables, as well as its direction. There are several different measures for the degree of a correlation, depending on the type of data that is evaluated. They all range between -1 and 1. A coefficient of 0 indicates that there is no correlation between the two variables. Values between 0 and plus 1 indicate a positive correlation. Values between 0 and minus 1 on the other hand imply a negative correlation. The thresholds when a correlation can be considered important is always a matter of context. A strong relationship is often considered from r=0.8, though. In general, we can state that the correlation coefficient increases with the degree of association between two variables.
Most frequently used is the Spearman rank correlation coefficient. The advantage of the Spearman rank correlation is that it does not require any further assumptions about the distribution of the data. And it is applicable for data that is at least on an ordinal scale. It cannot, however, differentiate between dependent and independent variables and it cannot, like mentioned before, capture nonlinear relationships between two variables.
It is very important to remember that a correlation between two variables does not imply a causal relationship between these! A third variable could be involved linking these two variables. Correlations of this kind are called spurious correlations. An experimental setup can show cause and effect (or causation), but a correlation coefficient can only predict a relationship. Studies tend to overinterpret correlation coefficients, concluding causal assertions when only correlational evidence was shown. Furthermore, only a test can show if the correlation is statistically significant.
Another interesting aspect of the correlation coefficient is that it can be used to evaluate how much of the variance (or distribution) of one variable can be explained by that of the other variable. For this we use the square of the correlation coefficient, also called the degree or coefficient of determination. For example, a correlation coefficient of 0.3 indicates that 9% (0.32= 0.09) of the overall occurring variance can be explained from the statistical perspective, and the other 91% remain unexplained.
If you are interested in a visual presentation of this topic, please feel free to follow us on our GCP Mindset YouTube channel! If you would like to know more about how we could implement statistics in your clinical trial, send us a mail to statistics@gcp-service.com.