
Cross tables are also known as contingency or multidimensional tables. Large amounts of data can be summarized in a structured way and possible relationships between important variables can be revealed. Cross tables have a matrix format in which the frequency distributions of the features of two variables are displayed.
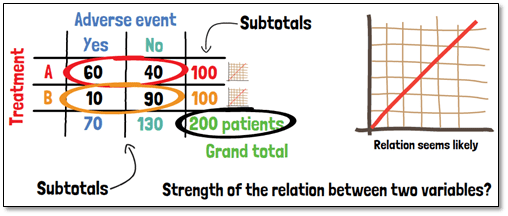
Let´s look at an example. We conduct a clinical trial with 200 patients and want to analyze the distribution of occurrence of adverse events in two treatment arms. We can separate the patients according to their outcome, whether an adverse event occurred or not, into two columns. In the rows, we then distinguish the two treatment arms. The dimension of a cross table is expandable depending on the classification of the used variables. This table allows anyone looking at it to see at a glance how the adverse events are distributed. From the frequencies displayed here we can already see that the proportion of adverse events is higher in the arm of treatment A, such that a relation seems likely.
Additionally, cross tables can provide subtotals for columns or rows, as well as the grand total. For illustrative purposes sometimes also images or plots can be found on the horizontal or vertical axis.
The strength of the relation that we suspect between the two variables can be measured by the odds ratio. We divide the number of patients suffering an adverse event by those not suffering an adverse event within the group of the patients that received treatment A. We can do the same for the patients of treatment B.
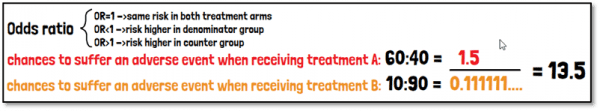
The odds ratio is then the ratio between these two proportions. It can be used to quantify the strength of the relation between the two variables. If the Odds ratio is equal to one, the risk is the same in both treatment arms. In case the Odds ratio is smaller than one, the risk is higher in the denominator group; and if larger than one, the risk is higher in the counter group. In this example, we would end up with an odds ratio of 13.5, telling us that it is much more likely to suffer an adverse event when receiving Treatment A.
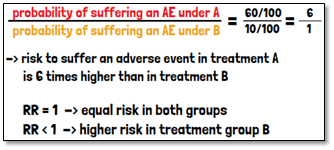
Another way of measuring the relation between two variables is the relative risk or risk ratio. It is defined as the ratio between the probability of suffering an adverse event if you receive one treatment and that when receiving the other. In this example the risk to suffer an adverse event is 6 times higher if you receive treatment A, than with treatment B. A relative risk of 1 indicates an equal risk in both treatment groups. A relative risk of smaller than one in this case would mean that the risk is higher in treatment group B.
The difference between odds ratio and relative risk is, that the odds ratio is calculated with the odds of an event in the two groups, whereas the relative risk is calculated based on probabilities. The relative risk is usually the parameter of interest in clinical studies. When working with rare diseases the odds ratio is a good approximation to the relative risk.
If you are interested in a visual presentation of this topic, please feel free to follow us on our GCP Mindset YouTube channel! If you would like to know more about how we could implement statistics in your clinical trial, send us a mail to statistics@gcp-service.com.