
When presenting the data descriptively, the distribution of single variables can include the following parameters: Scatter parameters such as the mean, median, and mode; dispersion parameters, which are the range, quartiles, variance, and standard deviation; and to define the shape of the distribution also skewness and kurtosis.
The mean is calculated by summing all occurring values and dividing the sum by the number of. The median is simply the value that is in the middle of the sequence of values, ordered by size. The mode on the other hand is the value which occurs most often in the data. So, these three aspects give us a good impression of the average participant, but we do not know yet how the data is spread. For that, we can look at the dispersion parameters.
The range of a distribution states between which minimum and maximum the values in our sample group are distributed. The quartiles, referred to as Q1, Q2 and Q3, are the values below which 25%, 50% or 75% of the data is found, respectively. And a measure for the diversity in a sample is the variance, which indicates how far from the mean value the data is dispersed on average. But usually, what is used when presenting the data, is the standard deviation, which is simply the square root of the variance. It tells you, how large the dispersion of the individual observation from the mean is. With all this information, we have some idea of the spread of the data.
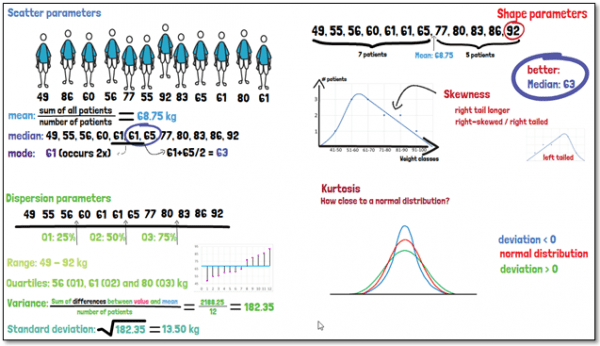
The skewness of a distribution curve gives an indication of how similar the curve looks like to the left and right from the mean value. If there are more data points below the mean than above, then the distribution is shifted towards the left. The right tail of the distribution curve would conversely be longer, which is why it is then called right-skewed or right-tailed. A skew occurs when there are extreme values on one end of the curve impacting the location of the mean. In these cases, describing the data using the median may be better than using the mean.
The kurtosis describes how closely a distribution resembles a normal distribution. Each value being observed has a certain probability that can be summarized using a curve. If we have a deviation of zero, the shape of the distribution equals a normal distribution. If the deviation is below zero, it means the distribution shows fewer and less extreme values than the normal distribution. The curve may seem to appear flatter at the extremes. Conversely, a deviation of more than zero means that the curve has more pronounced tails, and therefore has more extreme values than the normal distribution.
If you are interested in a visual presentation of this topic, please feel free to follow us on GCP Mindset YouTube channel! If you would like to know more about how we could implement statistics in your clinical trial, send us a mail at at statistics@gcp-service.com.