
General
What is the Role of Consulting in Clinical Research?
The field of clinical research is vital to the development of new treatments and therapies. It involves the study of health conditions in people, which

The field of clinical research is vital to the development of new treatments and therapies. It involves the study of health conditions in people, which

In the world of clinical research, Good Clinical Practice (GCP) is a fundamental framework that ensures the integrity and ethical conduct of trials. For more

Welcome to our blog, where today we will delve into the fascinating world of data management in clinical research. In this fast-paced era of technological
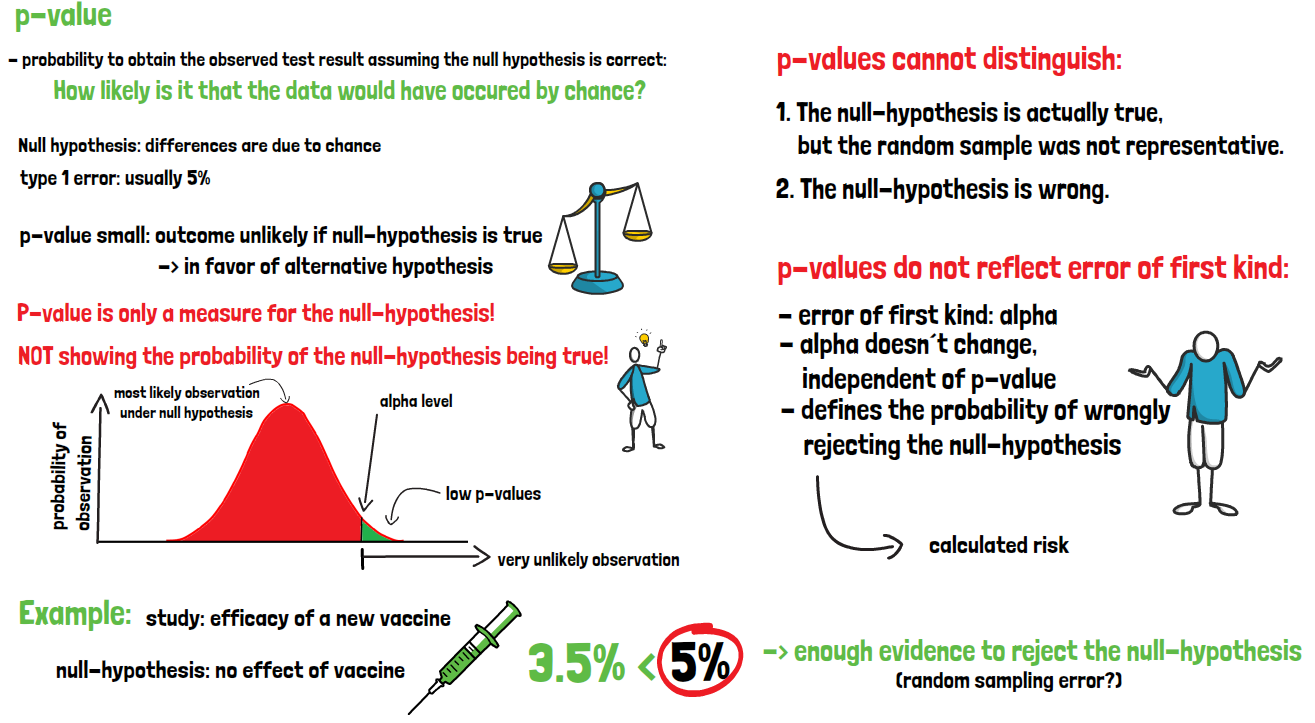
P-values show how large the probability is to obtain the observed test results assuming the null hypothesis is correct. Or in other words, how likely
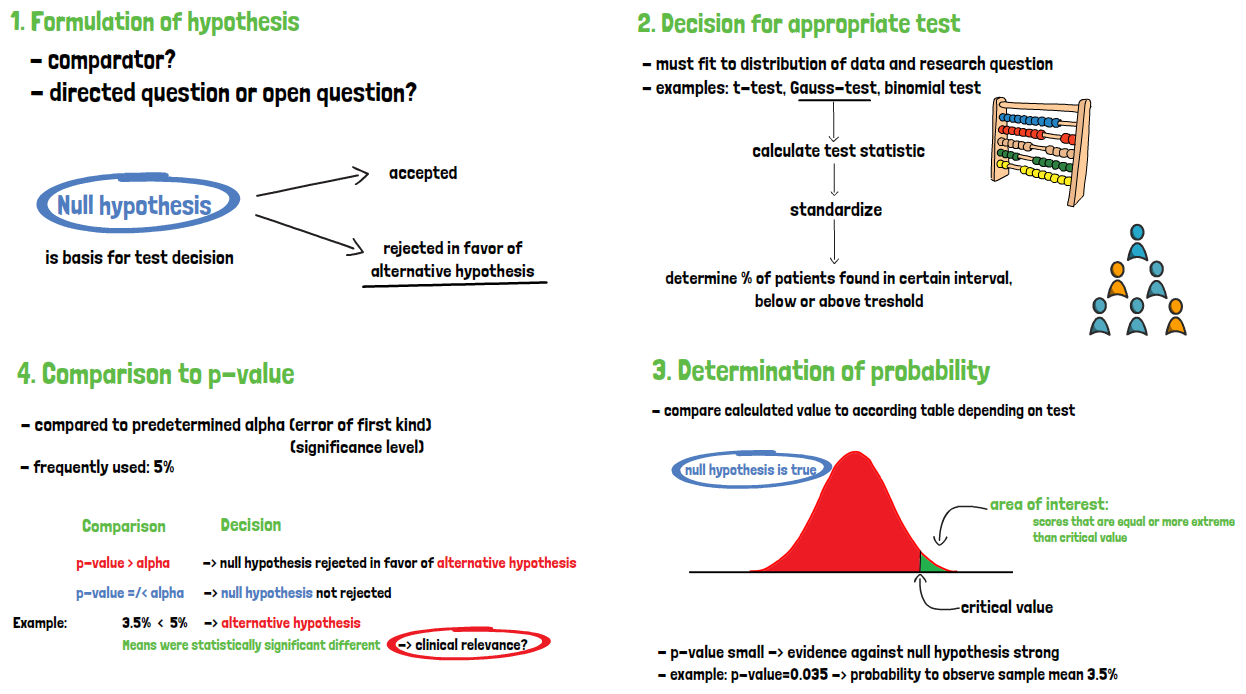
A test of significance consists of four steps. First, the null and alternative hypothesis must be stated. Second, the test must be chosen appropriately, and
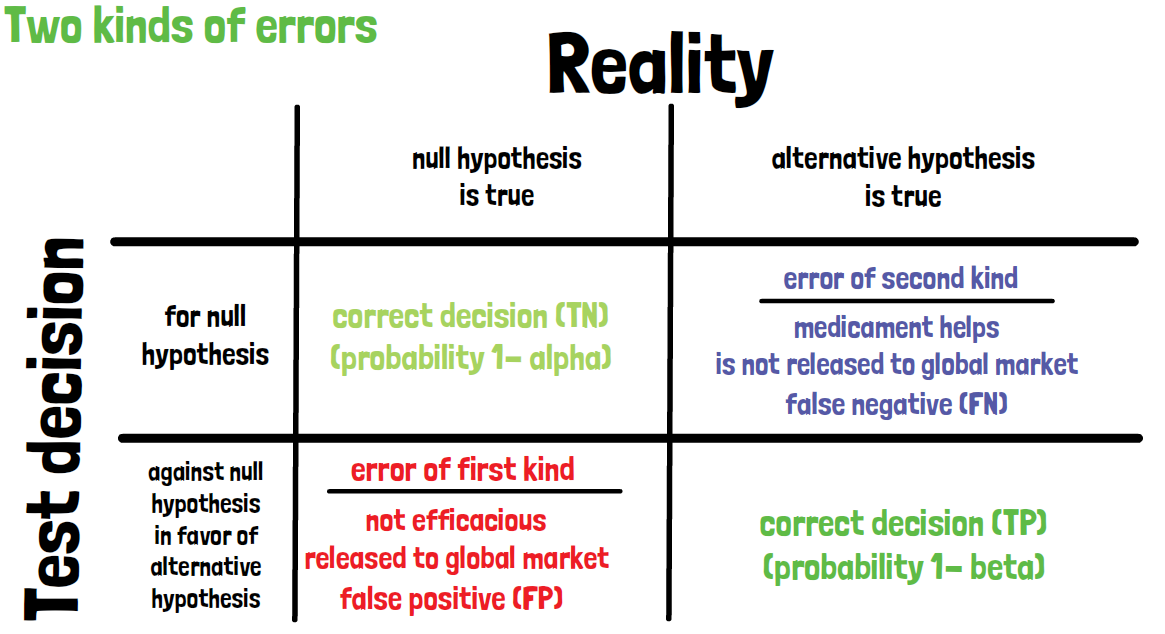
When applying a statistical test, there are always two hypotheses as a basis. The null hypothesis describes the non-favorable scenario, where the investigational product would
In every clinical trial, statistics play a very important part. Because based on the statistical analysis, decisions are made about new therapies, medicaments, or medical
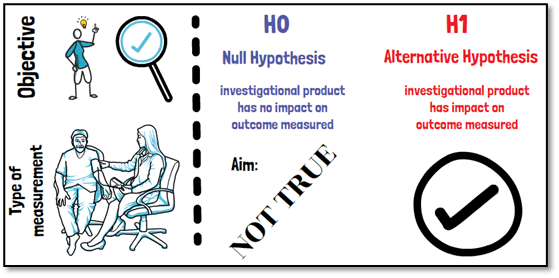
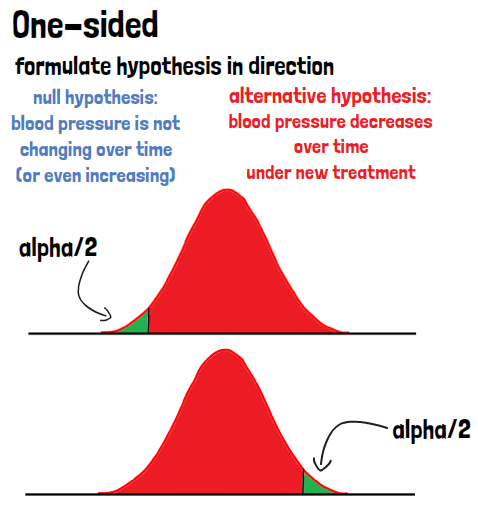
When conducting a clinical trial one of the most important aspects is to define the objective of a study and to decide on what the
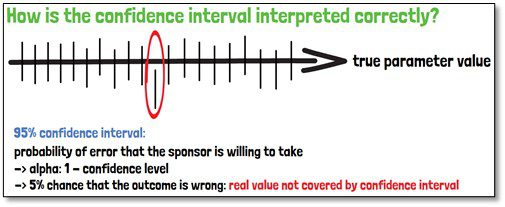
When it is about the precision of a test result, confidence intervals are a more useful measure than p-values, which only reflect the statistical significance. Confidence intervals provide additional information about how large the effect could be, so answering the question how the clinical relevance for the finding is.
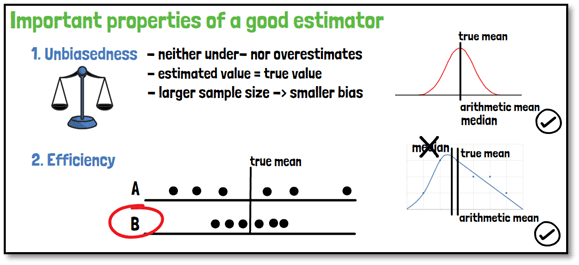
An example for a point estimator is the arithmetic mean when trying to find the mean of a population. A point estimator is used to